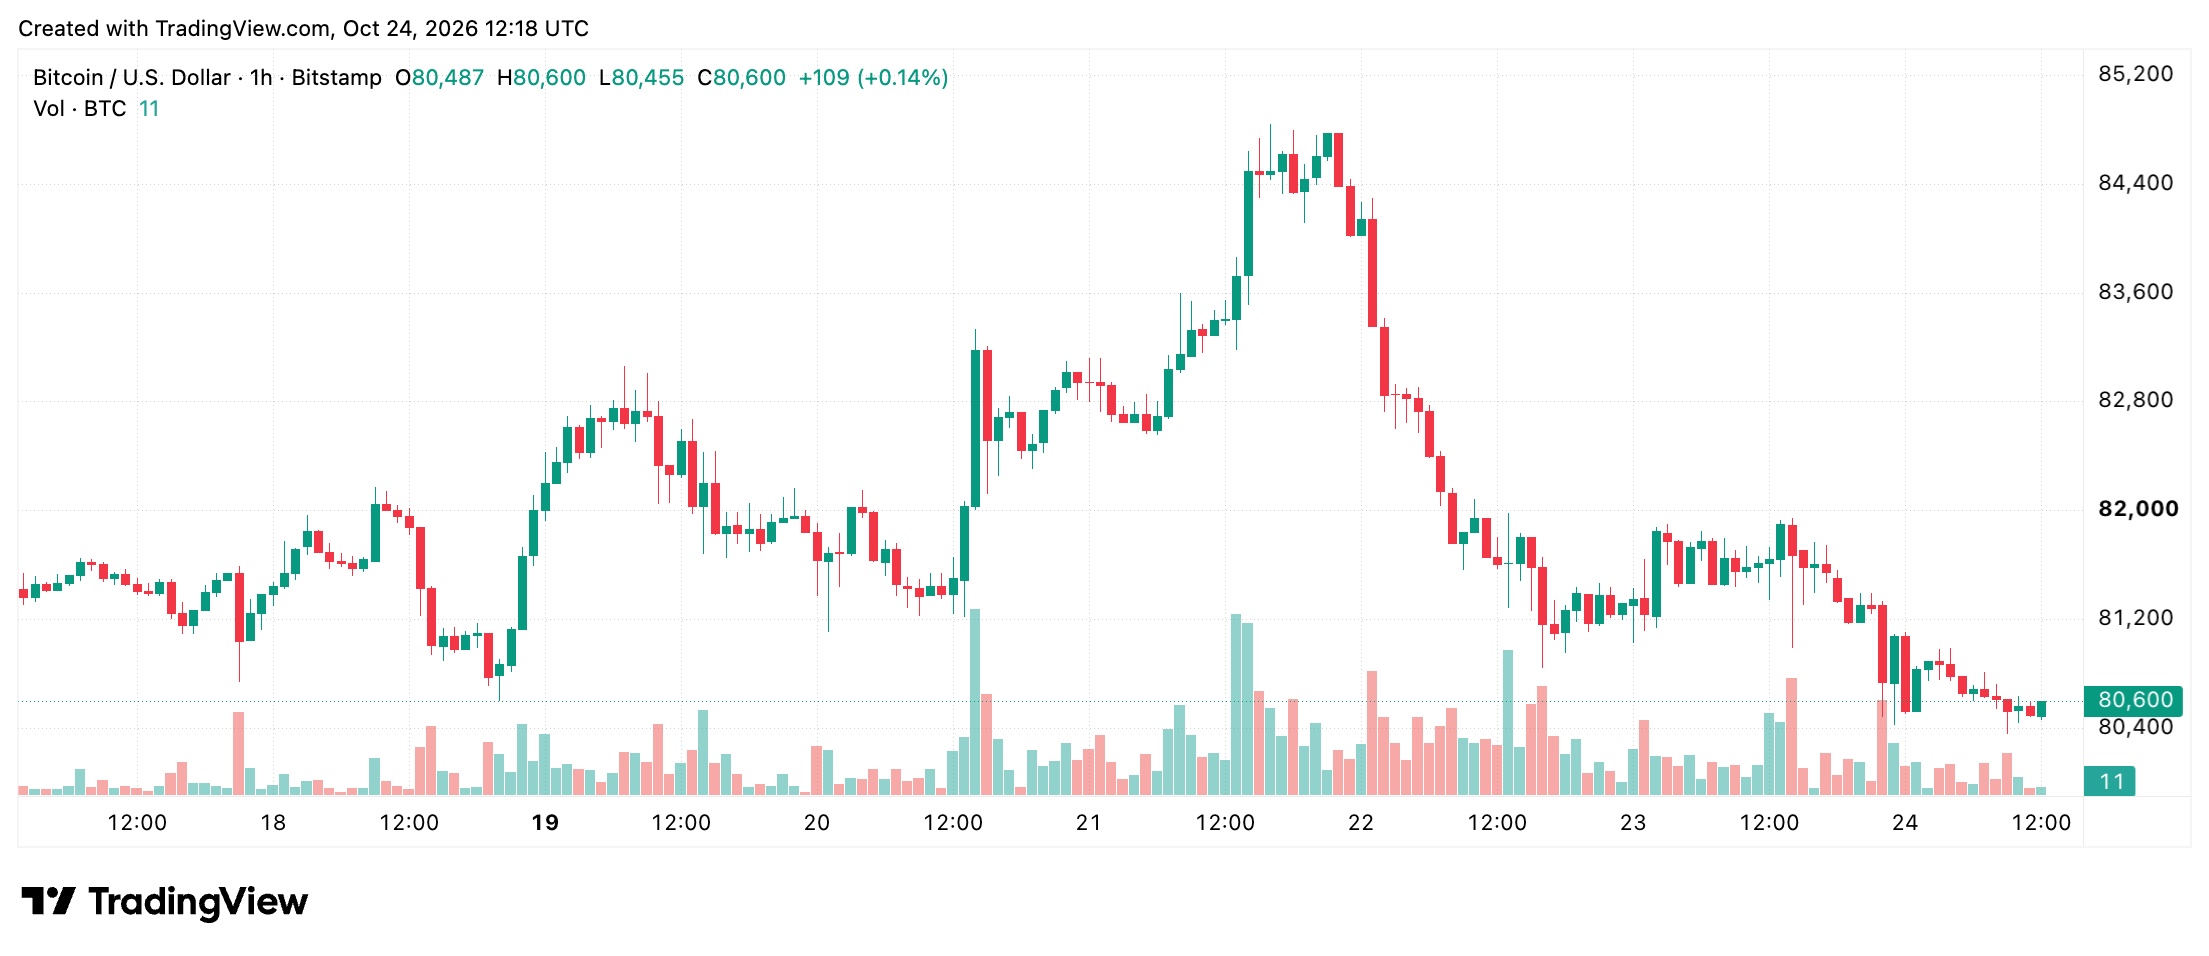
Bitcoin traded close to $80,500 on Saturday morning, 24 October, with short-term indicators pointing lower despite a more positive longer-term technical picture.
Exchange aggregation sites recorded a 24-hour low of $80,409, while Bitstamp data showed support near $80,351. The market remained technically bearish below $82,000, although mostly neutral oscillator readings suggested the latest selling had not yet developed into a decisive momentum breakdown.
At about 08:00 Eastern time, Bitcoin was near the bottom of its daily range. Around 10 of 15 moving average readings favoured further declines, while nine of 11 oscillators were neutral, leaving price action weaker than the momentum signals confirming it.
The one-hour BTC/USD chart showed the cryptocurrency trying to stabilise around $80,500 after its latest retreat. Falling volume during the most recent lows may indicate that selling pressure is easing, but buyers still face significant resistance.
A move above $80,800 would bring $81,200 into view. However, a renewed failure near $80,350 could expose the psychological $80,000 level.
The four-hour chart presents a clearer downside pattern. Bitcoin has fallen from about $84,843 to $80,499, forming a series of lower highs and lower lows as sellers repeatedly halted attempts to recover.
Resistance between $81,500 and $82,000 is the first major barrier. A sustained move above $82,000 would begin to challenge the current bearish structure, while another rejection in that area would leave the $80,350 support level vulnerable.
On the daily chart, Bitcoin remains under pressure after being rejected near $87,374. The $82,000-$84,000 area is now crowded with potential resistance as recoveries become less convincing. The broader $81,939 session high also provides a reference point for any attempted rebound.
A daily close below $80,000 would increase the possibility of a move towards $79,000 and potentially $78,000. Bitcoin has also closed a daily candle below its 50-day moving average for the first time since August, although its longer-term moving averages remain positioned positively.
The daily oscillator readings provide some balance to the weaker price structure. The relative strength index (RSI) was 43, indicating negative momentum without an extreme oversold reading. The Stochastic oscillator stood at 25, the commodity channel index (CCI) was minus 129 and the average directional index (ADX) measured 17, pointing to limited trend strength.
Moving average convergence divergence (MACD) was minus 203 with a bearish signal, while the momentum indicator stood at minus 1,074 but retained a positive classification. Overall, nine oscillator readings were neutral, compared with one positive and one negative.
Bitcoin was trading below its 10-period exponential moving average (EMA) at $81,860 and its 20-period simple moving average (SMA) at $82,528. The 50-period EMA at $80,782 was also above the market, adding to near-term resistance.
However, the 100-period EMA at $77,526 and the 200-period SMA at $72,899 remained below the current price, preserving the longer-term positive foundation.


