
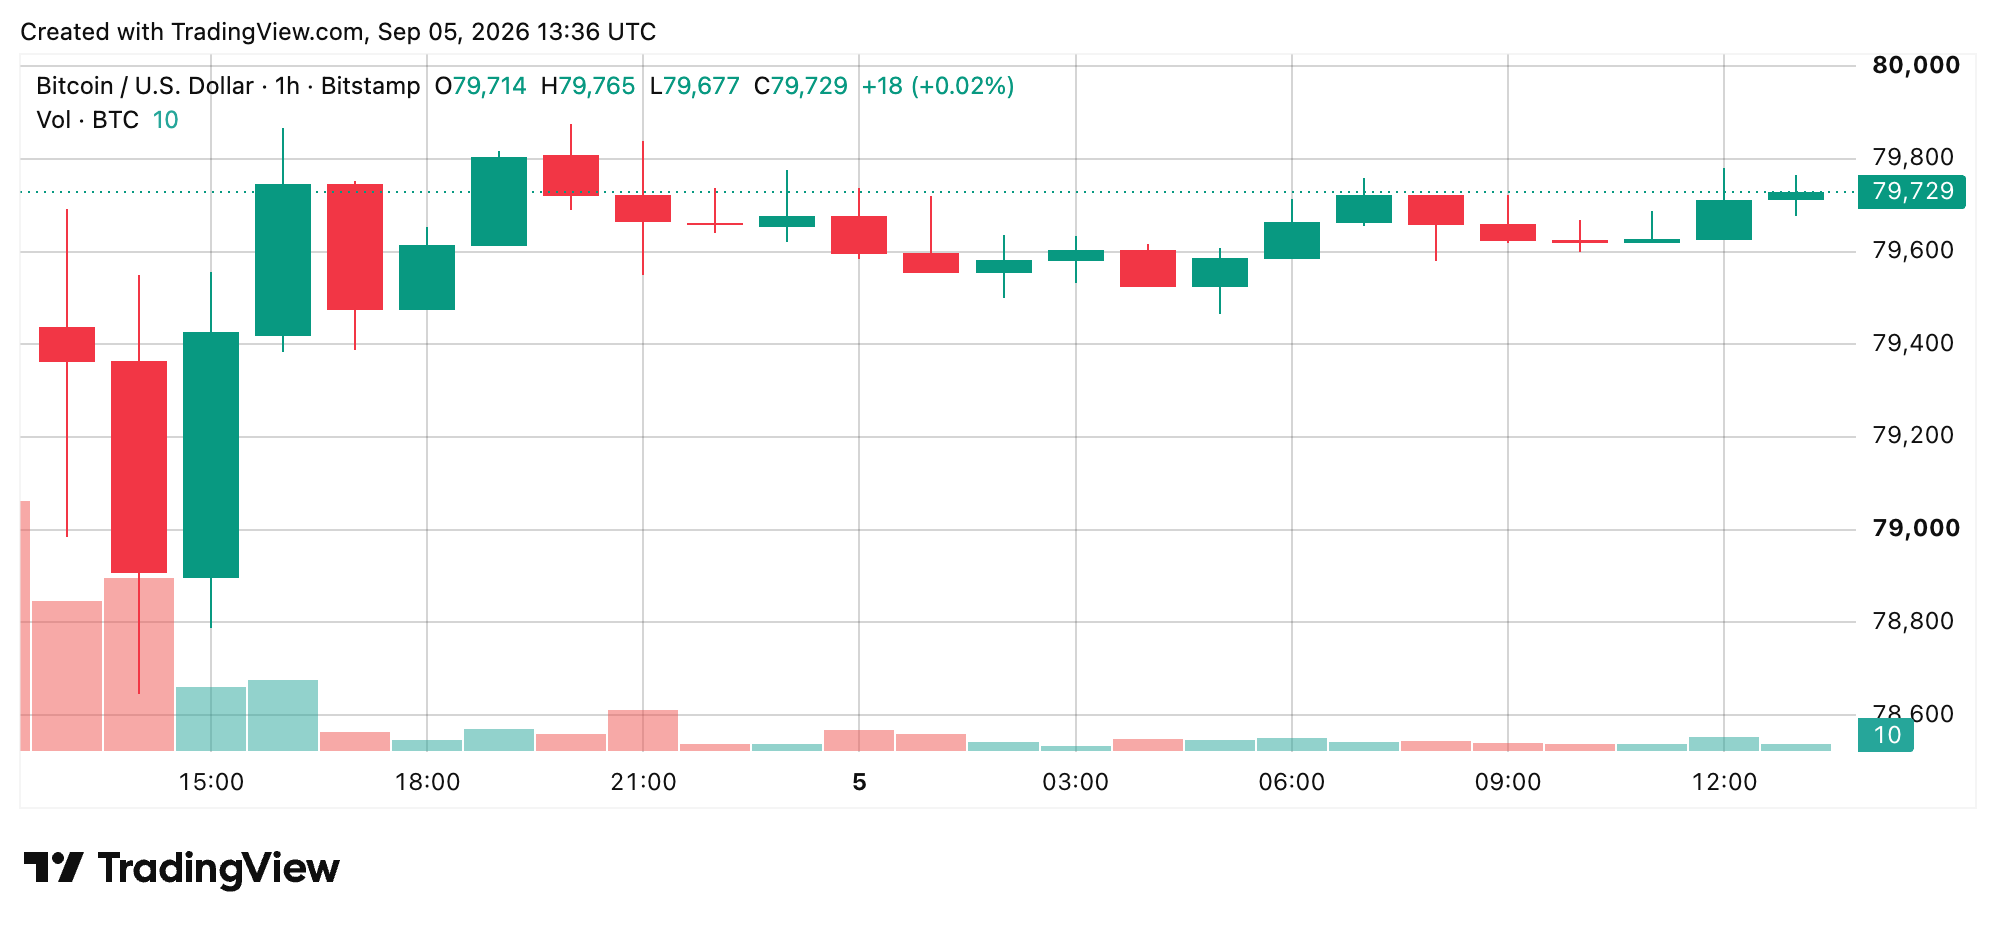
Bitcoin is trading just above $79,700 after a sharp rejection from $82,281, with the market focused on whether it can hold the $78,500-$80,000 range.
The cryptocurrency was up 0.26% over 24 hours at $79,715 on Saturday, 5 September, having moved between $78,706 and $79,848. That leaves Bitcoin caught between a strong longer-term trend and signs that its short-term momentum is fading.
On the one-hour chart, Bitcoin’s recent volatility has given way to a narrower period of consolidation. The price briefly surged to $82,281 before a large red candle, accompanied by a spike in trading volume, halted the advance. Buyers attempted to recover, but the rebound ran out of energy below $80,000, with subsequent candles clustering around $79,500-$79,800.
The $79,500 level is now central to the near-term outlook. Bids become thinner below it, while selling interest increases from $80,000 into the low $82,000s.
A sustained hold above $79,500, followed by a move through $80,000, would put the $81,000-$81,500 area in sight. However, a one-hour close below $79,200 could expose $78,700. A break beneath $79,500 would bring the $78,700-$78,500 area into sharper focus.
The four-hour chart shows the change in momentum more clearly. Bitcoin climbed rapidly from the high $77,000s into the $82,000 region, but the high-volume rejection stopped buyers in their tracks and sent the price back towards $79,500-$80,000.
The four-hour relative strength index (RSI) moved above 70 around the recent high before cooling into the low 50s in some readings on 4 September. That decline suggests a reset in momentum rather than a confirmed reversal of the wider trend.
Bitcoin is now navigating a $78,500-$82,300 range. Holding the $78,500-$79,100 area and reclaiming $80,000, followed by $81,500, would strengthen the case for further gains. A four-hour close below $78,500, by contrast, would make the $76,000-$77,000 zone vulnerable.
The daily chart continues to offer a more positive picture. Bitcoin remains above every listed simple moving average (SMA) and exponential moving average (EMA) from 10 through 200 periods, although $80,000 represents the first major obstacle on any attempted recovery.
Above that level, resistance is concentrated around $81,250-$82,281 and then at $82,800. Initial support is located at $78,706-$78,751, followed by about $78,125 and the rising 10-day moving-average band, which lies between $78,500 and $78,800.
A daily close through $81,250-$82,281 would indicate that the upward trend was resuming. A sustained close below approximately $78,125 would be more damaging and could open the way towards $76,000.
The weekend’s technical indicators are less decisive. The daily RSI is 67, the Stochastic indicator is 71, the commodity channel index (CCI) is 63, the average directional index (ADX) is 46 and the Awesome oscillator (AO) is 7,755. Each is giving a neutral or unconvincing signal.
Momentum, at 683, and moving average convergence divergence (MACD), at 3,322, are both showing bearish readings. Overall, the oscillator board records two negative signals, nine neutral signals and no positive signals.
That points to cooling momentum rather than a confirmed breakdown. The RSI remains below the conventional overbought threshold of 70, while an ADX reading of 46 indicates that a trend is still present.
The moving-average picture remains considerably stronger, with 13 bullish readings, one neutral signal and one bearish signal. The 10-day EMA and SMA stand at $78,503 and $78,798 respectively. The 20-day pair is at $76,067 and $76,455, while the 30-day averages are $73,958 and $72,229.
The 50-day EMA and SMA are at $71,386 and $69,091. The 100-day averages stand at $69,833 and $66,400, while the 200-day pair is at $72,563 and $69,686. The Hull moving average (HMA), at $80,193, is the only moving average showing a negative signal.
Bitcoin is about 14% above its 200-day SMA, underlining the strength of the broader trend but also highlighting the risk of a move back towards average prices for traders chasing the rally.
The cryptocurrency erased its 24-hour gains after reaching $82,281, falling below $78,700 before stabilising near $79,500. Its market capitalisation also fell.
For now, $78,500-$80,000 remains the key battleground. A clean move above $80,000 could rebuild momentum and bring $82,281 back into play. Continued weakness below the range would alter the outlook significantly.
Bulls retain control while Bitcoin holds the $78,500-$78,800 area, supported by the largely positive moving-average structure. But buyers must demonstrate that the longer-term strength can produce another sustained move higher.
Bears, meanwhile, need a decisive loss of $78,500 followed by pressure on the structural support around $78,125. A four-hour close below $78,500 would expose $76,000-$77,000, while a sustained daily close under roughly $78,125 would provide a stronger warning that the bullish structure was beginning to weaken.


