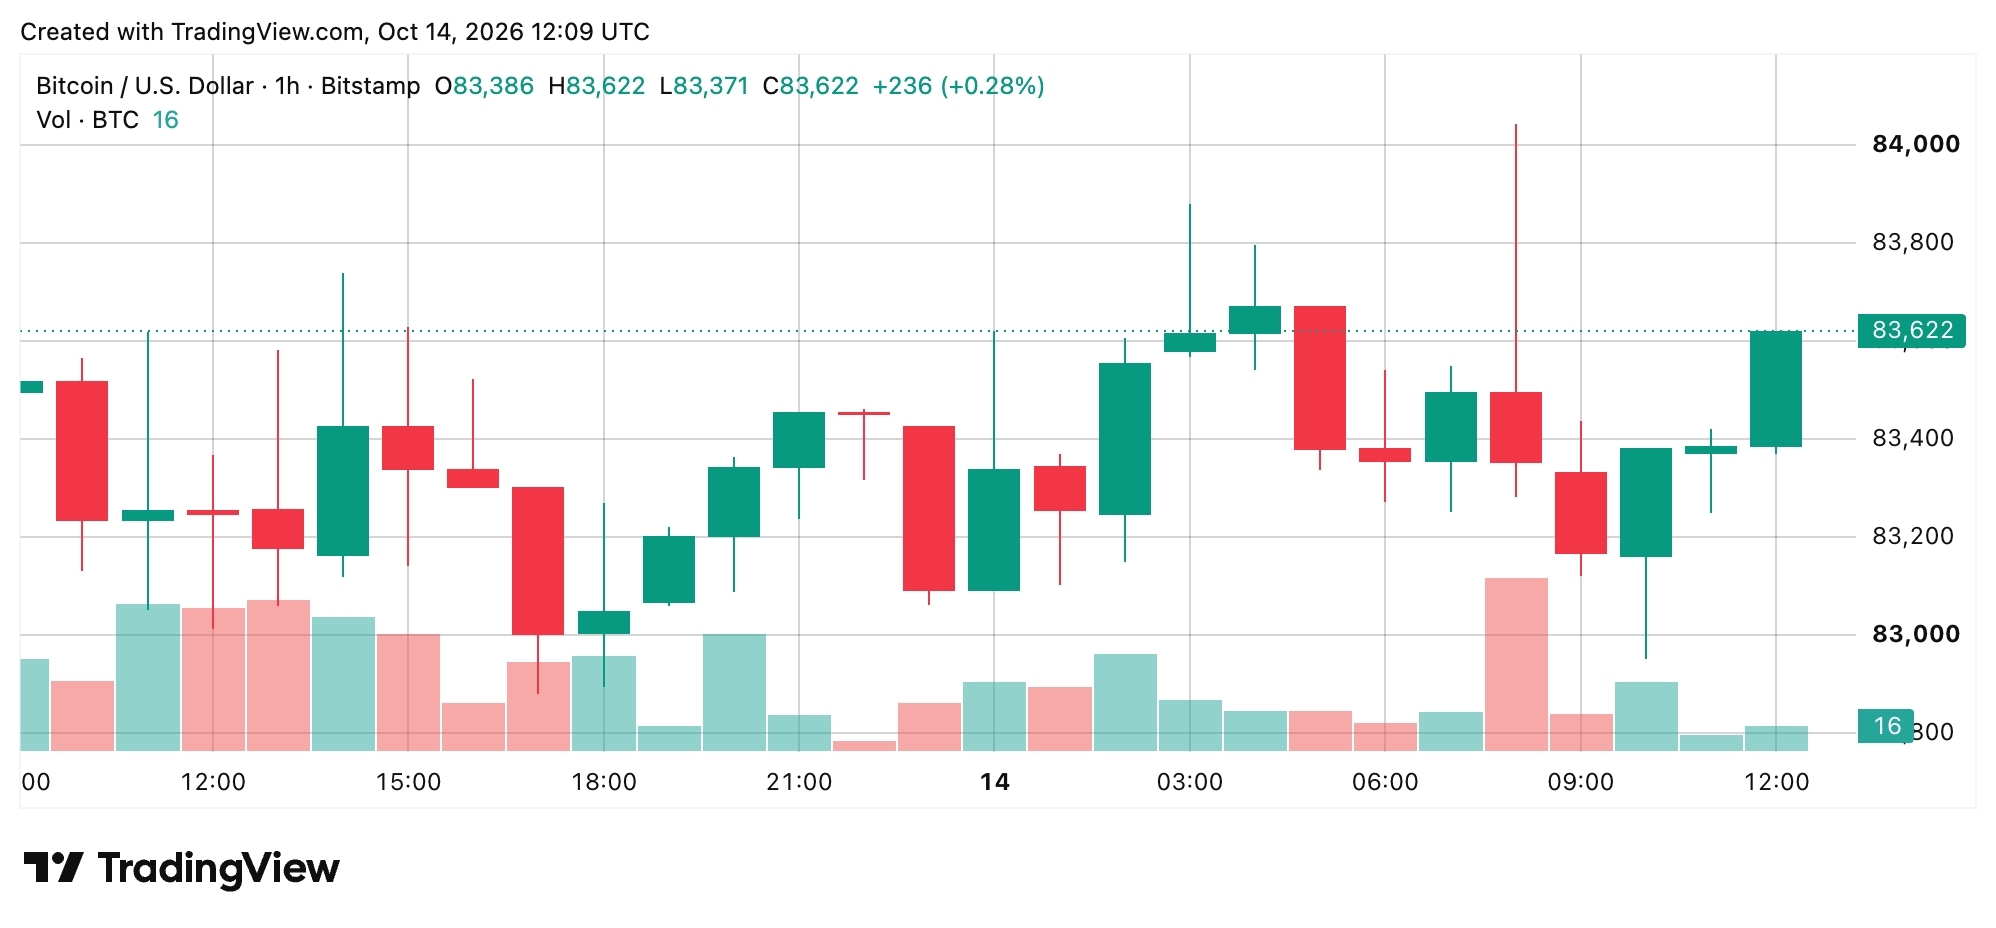
Bitcoin remained trapped below $84,000 on 14 October 2026, despite 12 of its 15 moving-average indicators pointing to bullish conditions.
The cryptocurrency traded between $83,250 and $83,790 over 24 hours, making only limited progress as sellers continued to defend resistance between $83,800 and $84,250. The technical structure of the recovery is improving, but price action remains hesitant.
On the one-hour chart, Bitcoin moved in a narrow range between $83,000 and $83,800. After recovering from lower levels, it settled around $83,350-$83,370, with moderate trading activity and weakening short-term momentum.
Buyers are relying on support at $83,000-$83,200, while the $83,500-$84,000 area continues to restrict attempts to move higher. A sustained break above $83,800 would bring $84,000-$84,250 into focus, but a fall below $83,000 could expose Bitcoin to a test of $82,500.
The four-hour chart offers a more positive view, although buyers have yet to complete the recovery. Bitcoin rose from about $80,308 before momentum stalled near $84,254, creating a significant barrier overhead.
Repeated attempts to break through $83,800-$84,000 have produced little lasting progress. A four-hour close above $84,250, supported by rising volume, would strengthen the case for a move towards $85,000. Another rejection, however, could send the price back towards $82,000-$82,500 and put the recent recovery structure under pressure.
On the daily chart, Bitcoin’s rebound from approximately $74,913 remains intact, although its advance was interrupted by rejection near $87,374. The price is consolidating around $83,300-$83,400, with support between roughly $82,000 and $82,900 and resistance concentrated at $84,000-$85,000.
The broader ascending channel remains relevant, but buyers must protect the lower end of the recent ranges. A daily close below $81,000 would significantly weaken the recovery case, while a move above $85,000 would improve the chances of a return to higher resistance levels.
Daily oscillators show no clear sign of an imminent breakout. The relative strength index (RSI) is 53 and the Stochastic is 35, both neutral. The commodity channel index (CCI) is minus 34 and the average directional index (ADX) is 27. The Awesome oscillator (AO) stands at 706, although momentum is minus 3,123, while the moving average convergence divergence (MACD) reading of 587 carries a bearish classification.
The Stochastic RSI fast reading is 17, Williams percent range is minus 55 and the Ultimate oscillator (UO) is 47, all neutral. Bull bear power at 483 is the only bullish classification, leaving eight neutral, two bearish and one bullish signal overall.
Moving averages are more encouraging: 12 are bullish, two bearish and one neutral. Bitcoin is above its 10-period exponential moving average (EMA) at $83,276, its 30-period EMA at $82,385 and its 50-period simple moving average (SMA) at $81,202. Longer-term support sits at the 200-period EMA of $75,647 and 200-period SMA of $72,215, while the 20-period SMA at $83,896 and volume-weighted moving average (VWMA) at $83,733 remain overhead.
U.S. crypto ETF flows improved sharply on Tuesday, with bitcoin funds attracting $175.62 million. Ether also snapped a 10-session losing run.


